MarketProfile Complete · MT5

Two views.
One session.

Choose the session. Read the profile.
Keep price and data in context.

This guide explains the workspace, its main controls and four real chart examples. Start with setup, then follow the images in order or use the quick reference while the indicator is open.

4 chart examples · XAUUSD · Free to read · MarketProfile Complete v0.16

First use

Start with a readable workspace.

Install through MQL5 using the official product link. Attach it to a chart for the symbol you want to inspect, then check these items before interpreting the display.

  1. Give it room. Use a chart area of at least 950 × 480 pixels; 1366 × 768 or larger is recommended. Maximize the chart if controls or panel text feel crowded.
  2. Load the history. The indicator needs usable M1 history from your broker. Allow synchronization to finish and check the Data view and coverage notes.
  3. Match the session. Review the session start/end in broker-server time. The default custom session runs from 00:00 to 00:00. There is no automatic exchange-timezone or daylight-saving conversion.
  4. Check the mode. Session profiles are the starting point for Profile + M30. Weekly and monthly profiles use the profile workspace. The workspace's candles remain M30 regardless of the underlying MT5 chart timeframe.
  5. Check whether you are reviewing history. AsOf = 0 is live mode. A nonzero AsOf value imposes a historical cutoff. Latest selects the newest loaded profile but does not remove this cutoff.
  6. Open Help. Read the effective session, row-size guidance and data notes for the current setup. Begin on a demo chart and change one display setting at a time.
Keep the profile grid consistent.

The fixed row size is an input setting. A number of trade ticks can represent a different price distance on a different broker symbol. Fit and Zoom change the display, not the underlying row setting. When comparing sessions, keep the same profile settings.

Understand the views

Choose what you need to inspect.

The two main presentations serve different reading tasks. Chronological columns provide an additional way to inspect a selected profile.

Multi-profile workspace

Turn off Profile + M30 to compare the loaded session profiles. Select a visible profile card or header, then compare its distribution, value area and POC with surrounding sessions. The number of loaded and visible profiles depends on the inputs and available data.

This guide's supplied screenshots focus on selected-session and TPO-column presentations; they do not show the full multi-profile layout.

Profile + M30

Use the button at the upper right to combine a selected daily profile with M30 candles. Read the profile and candles against their shared price area. Use the prior-session references as context and check which session is selected.

If TPO columns are active, selecting Profile + M30 returns to the combined candle display. This mode is available for session profiles.

TPO cols / Merged

Select TPO cols to inspect time brackets as separate chronological columns. The button changes to Merged. Select it again to leave the columns, or select Profile + M30 to return to the combined view. Use << TPO and TPO >> to page through the columns.

Read the references

Know what each level represents.

MarketProfile Complete is a TPO indicator. Its letters identify time brackets that visited price rows. This is not measured seconds at price, traded volume or verified buy/sell order flow.

Quick reference: TPO, POC, VAH, VAL & IB

POC · Point of Control

A reference for the most prominent TPO row in the selected profile. It need not sit at the middle of the session range. POC is amber in these screenshots.

VAH & VAL · Value area

The upper and lower boundaries of the selected profile's value area. The default target is 70%. Their teal/cyan lines frame value in these examples; always read the labels.

IB · Initial Balance

The opening-period range; the default period is 60 minutes. Its high and low help you compare later activity with the session opening. An extension beyond the range does not guarantee continuation.

TPO letters and columns

Letters identify the session's time brackets, 30 minutes by default. The merged presentation emphasizes profile shape, while the columns retain their chronological arrangement.

Developing and completed

A developing session is still in progress. A completed session has finished, but corrected broker history or different inputs can still change the historical display. Do not assume a final profile was known earlier.

Observation time and current price

Read the reported observation time and status. A current Bid line and the last closed price refer to different observations and may differ. Neither is a promise that the entire history is complete.

The chart collection

Four examples. A consistent reading process.

These original historical screenshots preserve the indicator display. Explanations sit below each image so the chart remains readable. They illustrate the interface, not a tested strategy or trading results.

Example 1 · Historical XAUUSD chart

Read the profile beside price
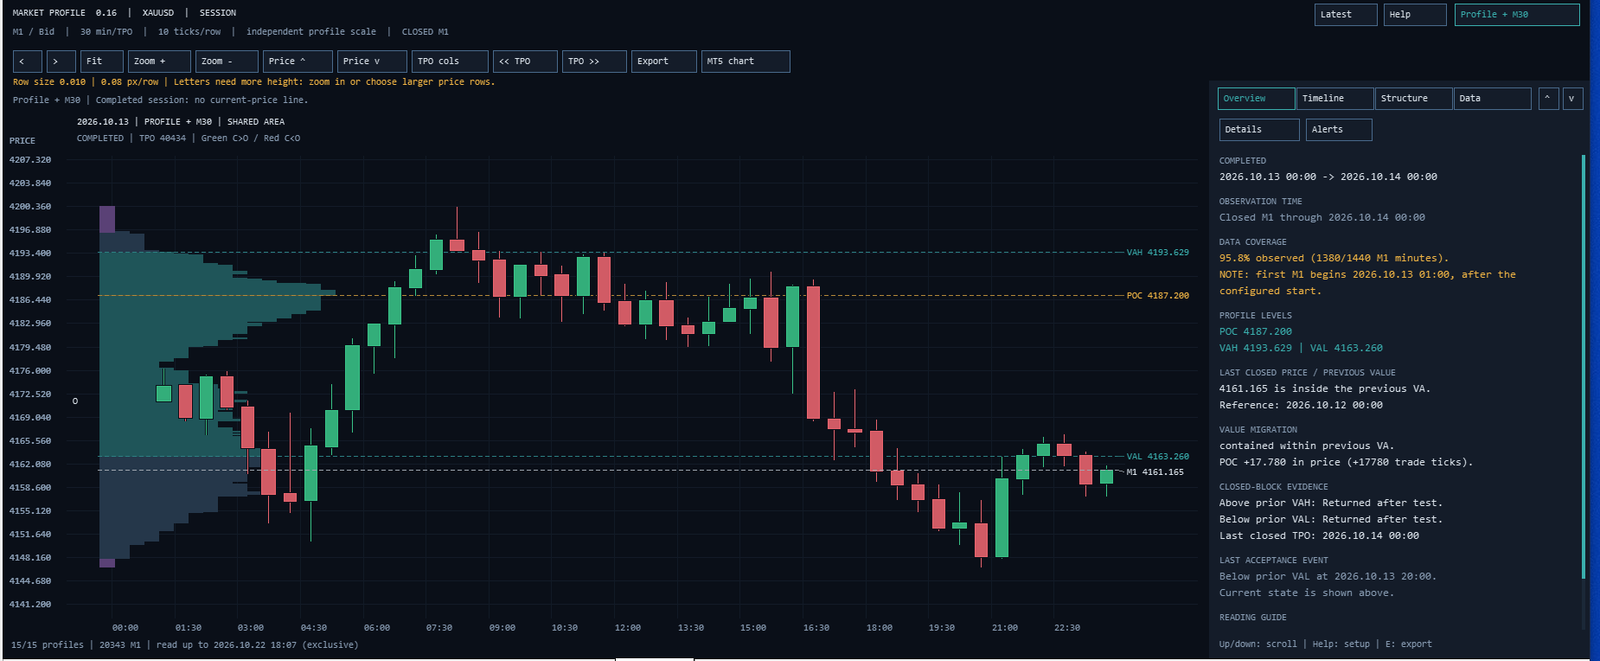
MarketProfile Complete showing a completed session TPO profile beside M30 candles and the Overview panel
Profile + M30 — completed session, 13 October 2026View full-size ↗ (new tab)

Read this example

Start with the selected session date. Locate the profile, its POC and value-area boundaries, then compare them with the M30 candles. The candles provide price context; the profile shows the distribution of TPO observations across price rows.

What to check

Read the Overview panel as a summary of the selected session at the moment of capture. Its labels are observations, not instructions to buy or sell.

Before interpreting the chart

Confirm the selected date, session status and observation time. Read the coverage note in Overview: a completed session can still contain gaps in the broker's available history.
Example 2 · Historical XAUUSD chart

Keep completed-session context separate

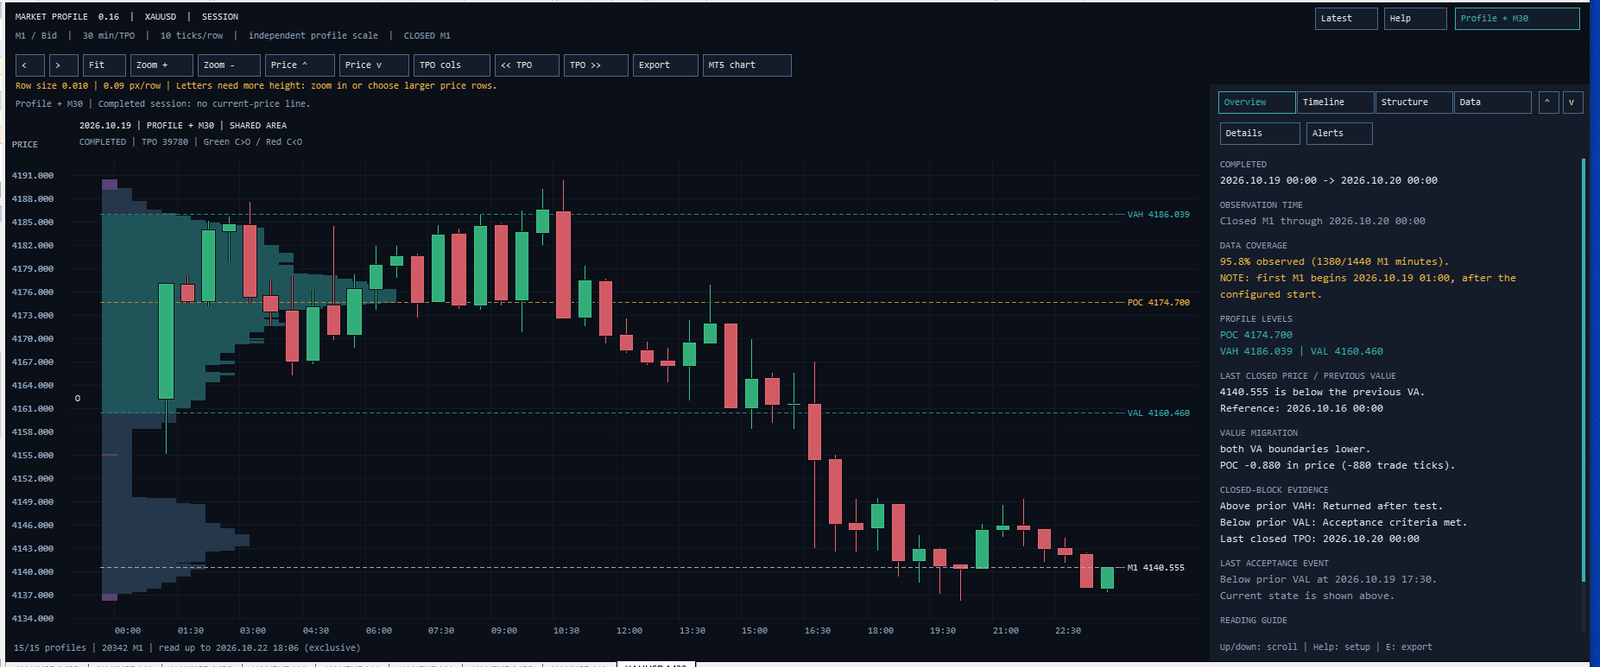
MarketProfile Complete completed session display for 19 October 2026 with TPO references and the Overview panel
Completed session — 19 October 2026View full-size ↗ (new tab)

Read this example

Use the selected date and session status to establish which period you are examining. Compare the location of the value area with price and the session range before drawing conclusions from the profile shape.

What to check

A completed session is useful for review, but this screenshot alone does not show when every reference first became available during that session.

Before interpreting the chart

Confirm the selected date, session status and observation time. Read the coverage note in Overview: a completed session can still contain gaps in the broker's available history.
Example 3 · Historical XAUUSD chart

Change the view, keep the session

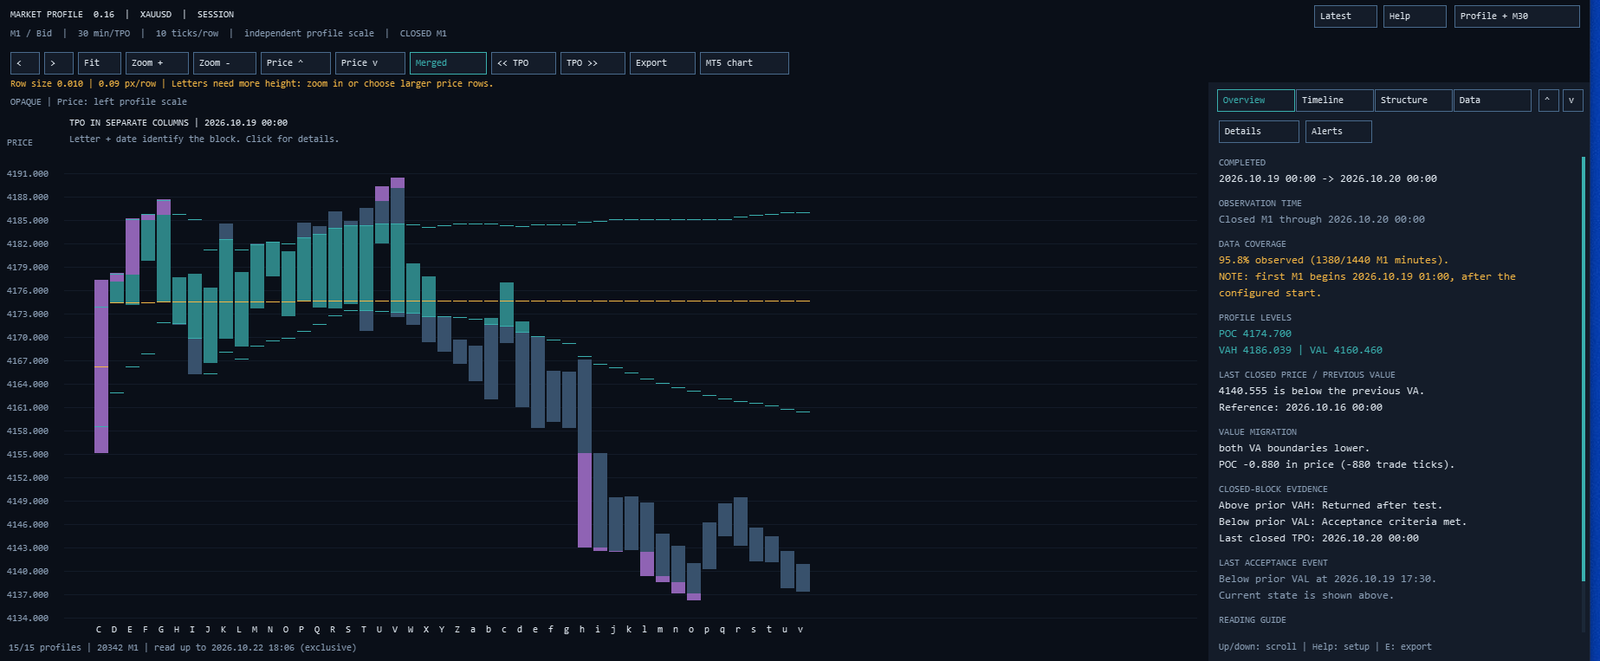
MarketProfile Complete chronological TPO columns for the same 19 October 2026 session shown in the previous example
Chronological TPO columns — the same 19 October sessionView full-size ↗ (new tab)

Read this example

This is the chronological TPO-column view of the same session as the previous example. Follow the time brackets across the columns to inspect which price rows were visited as the session progressed.

What to check

Use TPO cols to enter this presentation; the button becomes Merged. Use the TPO paging buttons when the available columns extend beyond the visible area. This image is not the multi-profile overview.

Before interpreting the chart

Confirm the selected date, session status and observation time. Read the coverage note in Overview: a completed session can still contain gaps in the broker's available history.

Example 4 · Historical XAUUSD chart

Treat a developing session as unfinished

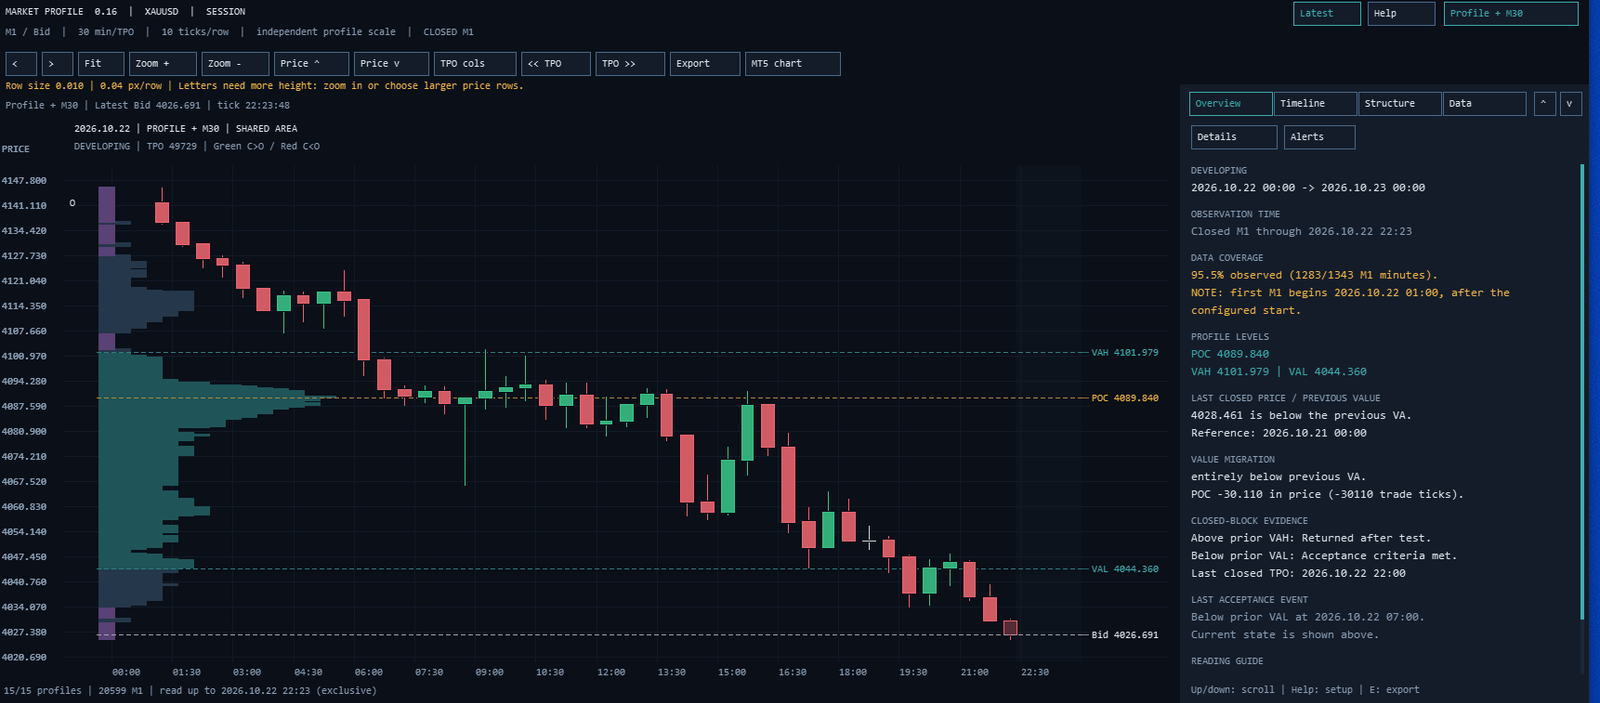
MarketProfile Complete developing session display on 22 October 2026 with profile references and the Overview panel
Developing session — 22 October 2026View full-size ↗ (new tab)

Read this example

Check the selected session and current state first. As new market data arrives, the current profile and its references may develop. Read the profile, price location and panel together.

What to check

Save a timestamped note before observing later price action. Compare the later display with that earlier record rather than assuming the final profile was already known.

Before interpreting the chart

Confirm the selected date, session status and observation time. Read the coverage note in Overview: a completed session can still contain gaps in the broker's available history.

Keep this reference nearby

The controls, in plain language.

Some labels shorten when the panel is narrow: Overview becomes View, Timeline becomes Time and Structure becomes Struct.

Select and navigate

  • < / >: select the previous or next loaded profile.
  • Latest: select the newest loaded profile. An active AsOf cutoff remains in force.
  • Profile card/header: click to select that visible profile.
  • MT5 chart / Show MP: hide the workspace to see the underlying MT5 chart, then restore it.

Fit the display

  • Fit: return to the configured price window. With ViewRows set to 0, use the full available span.
  • Zoom + / Zoom −: adjust the displayed row height.
  • Price ^ / Price v: move the visible price window up or down.
  • Help: read the current setup and operating guidance.

Read the information panel

  • Overview: start with the selected-session summary, levels and status.
  • Timeline: inspect the sequence of time brackets. Selecting a TPO cell opens the related block.
  • Structure: inspect the profile's structural observations.
  • Data: review the available history and data context. Selecting a price row also opens Data.

Control the amount of detail

  • Details / Summary: switch between the full report and its summary.
  • Alerts: inspect notification status and recent events.
  • Panel ^ / v: scroll the panel when its contents extend beyond the visible area.
  • Export: save analysis records for your own review.

Make your review repeatable

Observe first. Compare later.

A useful chart record includes the settings and the time the information was observed.

  1. Keep the context fixed. Record the broker symbol, selected session, session schedule, row setting and display mode.
  2. Save the current observation. Note the timestamp, profile status, POC and value-area boundaries. Save the chart before watching the next period.
  3. Review what changed. Compare the later profile and price with your earlier record. Developing levels can move as the session progresses.
  4. Use historical cutoffs deliberately. A nonzero AsOf value limits the review to a selected point. Set it back to 0 when you intend to return to live mode; Latest alone does not do this.

Optional notifications

Enable the desired event categories and delivery settings. Push notifications also require InpAlertPush and configuration in MT5 under Tools → Options → Notifications, with the desktop terminal running and connected.

External notification delivery is disabled during AsOf review and in the Strategy Tester; tester events are local only. A notification is an observation to review, not an order or an instruction to trade.

Export for your own records

Export saves CSV records and a text report in the terminal's data area. Use File → Open Data Folder and look under MQL5/Files/MarketProfile_Complete_v0_15. The folder retains this older name in version 0.16.

Keep the symbol, session settings and observation time with your exports. They document an analysis snapshot, not verified trading performance.

If the display is not what you expect

Profile missing or incomplete

Check broker M1 history, the selected session and the Data view. Market closures, broker breaks, no ticks and missing data can all affect coverage. Allow history to synchronize before retrying.

Profile + M30 unavailable

Check that session profiles are selected. Weekly and monthly profile modes do not use the combined M30 presentation.

The workspace looks too large or narrow

Maximize the chart, try Fit and adjust Zoom. Check the fixed row setting separately in Inputs; display zoom does not change the underlying grid.

Latest still shows an old date

Check AsOf and the loaded history range. Latest only selects the newest loaded profile and does not turn a historical cutoff off.

Push notification does not arrive

Check the event category, InpAlertPush, terminal Notifications setup and connection. AsOf review and the Strategy Tester do not send external notifications.

Still need help?

Record the product version, broker symbol, selected session, inputs and exact message. Remove private account details before sharing a screenshot with support.

Keep the evidence in context.

TPO profiles describe the available chart data. They do not guarantee future price behavior. These historical images are educational examples; they are not a performance record. Risk disclosure →

Guide for MarketProfile Complete v0.16 · 24 October 2026 · Chart images supplied by QuantLume.