Example 01 · XAUEUR / H1
Reading price around profile levels
What the chart shows
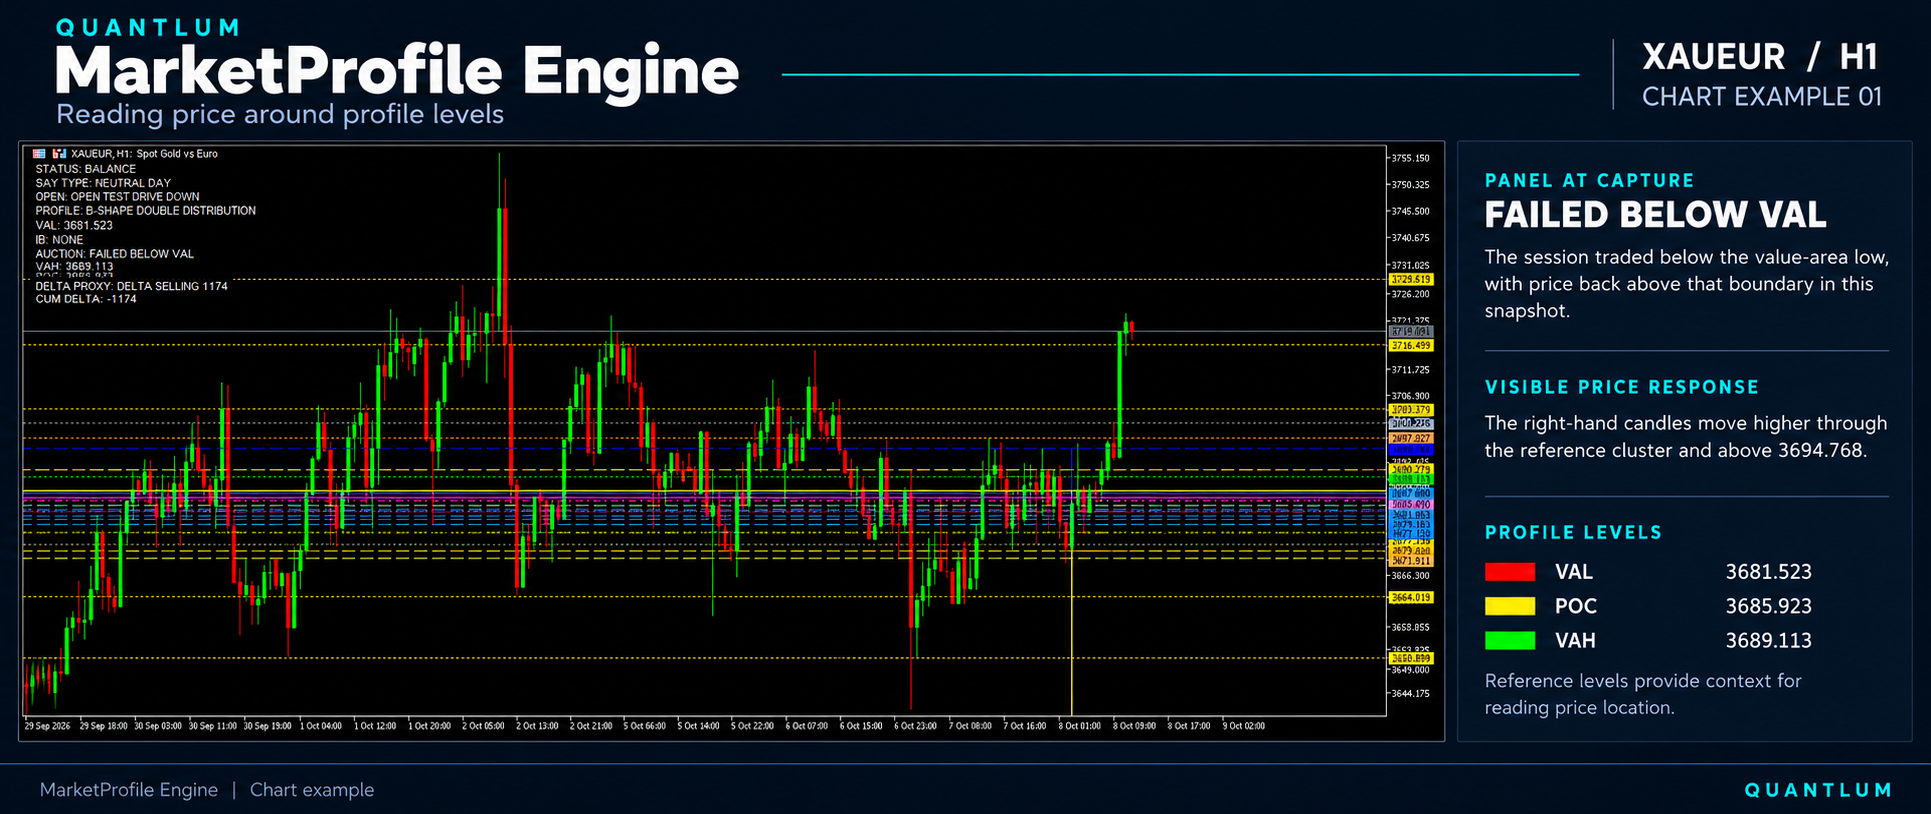
Start with the red VAL, yellow POC and green VAH in the image legend. Price has moved repeatedly through the dense reference area. On the right, it rises out of that area and above the marked 3694.768 reference.
How to read it
The panel says “FAILED BELOW VAL” at capture: the session has traded below the lower value boundary and price is back above it. This describes the indicator’s current assessment; it is not a label for every candle in the image. Notice how several levels sit close together, forming an area to study rather than one exact turning price.
Look closer
Compare a brief wick through a boundary with several candles remaining beyond it. Does price return to the cluster or continue away?